DOGE Price Prediction: Technical Indicators and Regulatory News Create Complex Investment Landscape

#DOGE
- Technical Positioning: DOGE trades below its 20-day moving average with bearish MACD signals, but remains within Bollinger Band boundaries suggesting contained volatility.
- Mixed News Sentiment: Regulatory developments create uncertainty while technical analysis presents conflicting buy/sell signals for the cryptocurrency.
- Defined Risk Parameters: Clear technical levels at $0.1366 (support) and $0.1637 (resistance) help establish risk-reward frameworks for potential positions.
DOGE Price Prediction
Technical Analysis: DOGE Shows Mixed Signals Near Key Moving Average
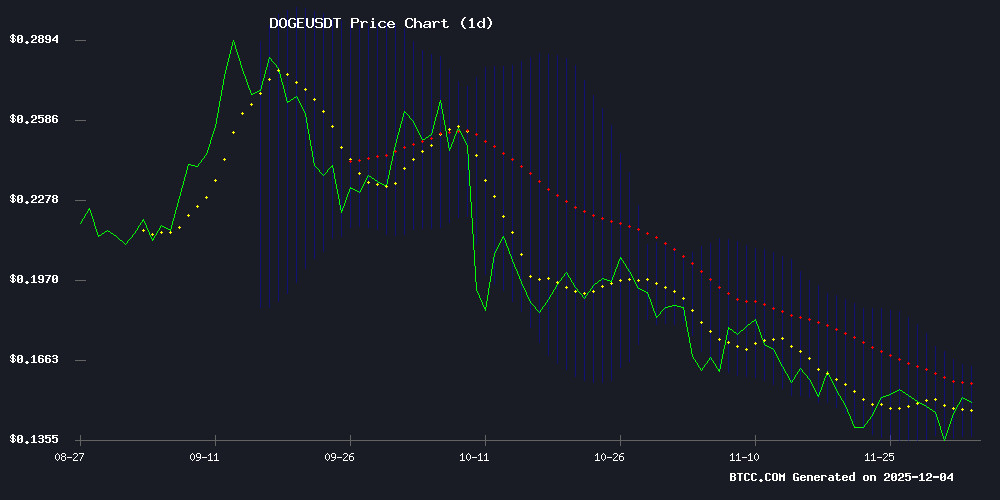
According to BTCC financial analyst Emma, DOGE is currently trading at $0.14867, slightly below its 20-day moving average of $0.150149. This positioning suggests the cryptocurrency is testing a crucial support-resistance level. The MACD indicator shows a bearish crossover with the signal line at 0.008569 above the MACD line at 0.005514, generating a negative histogram of -0.003055. However, the Bollinger Bands reveal DOGE is trading closer to the middle band than the lower band, indicating the current price decline may be moderate rather than severely oversold. The upper band at $0.163704 and lower band at $0.136594 create a trading range that could contain price action in the near term.
Regulatory Developments and Technical Patterns Shape DOGE Sentiment
BTCC financial analyst Emma notes that recent news presents a complex picture for Dogecoin. Regulatory developments, particularly Citadel's advocacy for SEC oversight of DeFi platforms, could introduce uncertainty for the broader cryptocurrency market including meme coins like DOGE. Meanwhile, technical analysis headlines suggest conflicting signals: rejection at the $0.153 resistance level indicates selling pressure, while the TD Sequential indicator's buy signal and articles discussing sustained momentum create a more optimistic narrative. This mixed sentiment environment requires careful monitoring of both regulatory developments and technical breakouts.
Factors Influencing DOGE's Price
Citadel Advocates for SEC to Regulate DeFi Platforms Like Traditional Exchanges
Citadel Securities has urged the U.S. Securities and Exchange Commission (SEC) to impose stricter regulations on decentralized finance (DeFi) platforms, arguing against broad exemptions that would allow tokenized U.S. equities trading without traditional oversight. The firm contends that such exemptions could create a dual regulatory framework, leading to market confusion and inequity.
Institutional activity around Dogecoin saw early-week accumulation followed by sell-offs as prices approached $0.1670. Despite muted broader sentiment, DOGE's technical structure remains resilient, with potential for a breakout above $0.16.
Citadel's letter to the SEC emphasized that many DeFi platforms already function like exchanges, utilizing automated algorithms to match buyers and sellers. The firm called for full identification of all intermediaries in tokenized stock trades, including DeFi protocols, wallet providers, and automated market makers.
Dogecoin Faces Rejection at $0.153 But TD Sequential Suggests Buying Opportunity
Dogecoin (DOGE) encountered resistance at the $0.153 level, coinciding with the middle Bollinger Band, leading to a slight pullback. The meme coin is currently trading at $0.1496, down 0.6% over the past 24 hours.
Despite the short-term rejection, the TD Sequential indicator flashes a buy signal, hinting at potential upside. Market participants are weighing technical patterns against Dogecoin's volatile history as a crowd favorite.
Dogecoin Gains Momentum: Are Price Changes Here to Stay?
Dogecoin trades near $0.15 despite a minor 24-hour dip, sparking debate over whether its resurgence marks the beginning of a sustained rally or a fleeting rebound. The meme cryptocurrency has benefited from broader market recovery, with heightened trading volume fueling speculation.
Institutional interest grows as 21Shares files its fifth Dogecoin ETF application with the SEC. Proposed under the ticker "TDOG," the fund would charge a 0.50% management fee payable in DOGE and track a CF benchmark index. Approval could bridge the gap between crypto and traditional finance, offering institutional investors regulated exposure to the asset.
Technical analysts identify a Falling Wedge formation—a classic bullish reversal pattern—as DOGE consolidates near key levels. Market participants await confirmation of breakout momentum that could validate the pattern's historical tendency to precede upward moves.
Is DOGE a good investment?
Based on current technical indicators and market developments, DOGE presents a speculative opportunity with defined risk parameters rather than a clear-cut investment recommendation.
The technical picture shows DOGE trading at $0.14867, below its 20-day moving average of $0.150149, suggesting mild bearish pressure in the short term. The MACD bearish crossover supports this view. However, the Bollinger Bands position indicates the cryptocurrency isn't in extreme territory, trading closer to the middle band than the lower support level.
| Indicator | Value | Interpretation |
|---|---|---|
| Current Price | $0.14867 | Below 20-day MA, testing support |
| 20-day MA | $0.150149 | Immediate resistance level |
| MACD Histogram | -0.003055 | Bearish momentum |
| Bollinger Upper | $0.163704 | Potential resistance zone |
| Bollinger Lower | $0.136594 | Key support level |
News sentiment is mixed. Regulatory developments could create headwinds for the entire cryptocurrency sector, while technical analysis suggests both buying opportunities and resistance challenges. The TD Sequential buy signal conflicts with the price rejection at $0.153, creating uncertainty about immediate direction.
For investors considering DOGE, key factors include: tolerance for volatility, portfolio allocation to speculative assets, and time horizon. The $0.1366 Bollinger lower band provides a clear downside reference, while a break above the 20-day MA at $0.15015 could signal improved momentum. Given the mixed technical signals and regulatory uncertainty, position sizing should be conservative relative to overall portfolio value.
